Matrix Table in SSRS
What is Reports:
Reports are used to give brief description out of the solution. The information is presented in clearly in structured format, it is easy to understand to all.
How to implement Matrix table in Report Builder in easy process:
Follow below steps to design matrix table.
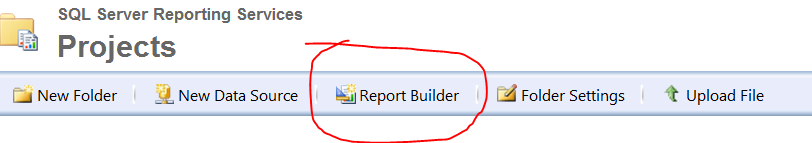
1) Open SQL server Reporting services and then choose Report Builder Tab. It's redirect to Report
Builder then choose blank Report Option.
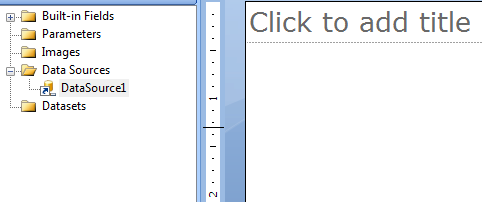
2) Add DataSource to the newly added report by right clicking the DataSource tab available in left
most corner of the page and then choose add new datasource option.
3) One new pop up window will open there itself you just connect to your DataBase and then test the
connection. If connection is working successfully means DataBase is connected successfully. Now
you are easily connect to your DataBase to display the result in your Report.
4) After added DataSource then add DataSet to the Report by right clicking the DataSet on left most
corner of the page, then choose add new DataSet option then it’s open one pop up window .
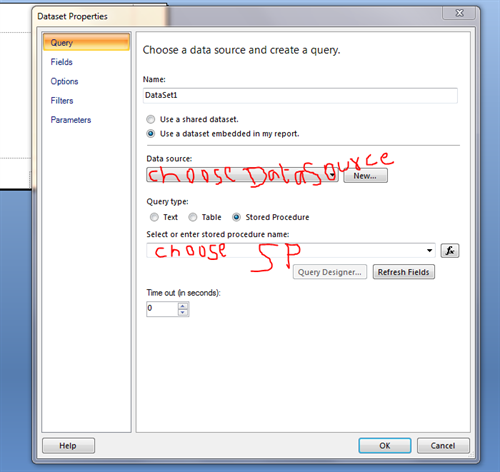
5) Here you can give your DataSet Name choose DataSet embedded in my Report Radio button.
This means you are able to communicate to DataSet to display the result into your Report.
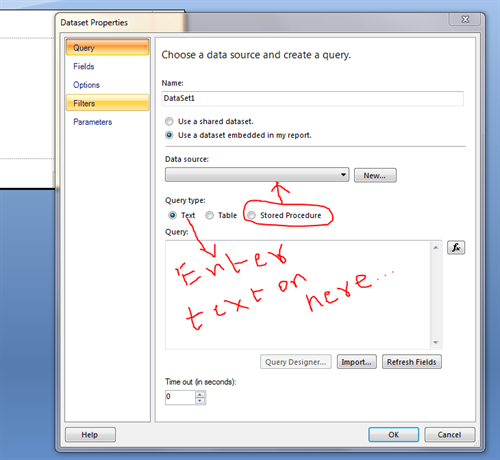
6) After that choose DataSource in the Dropdown, if you are using Select Query result to be displayed
in the Report then use Query Type should be Text . If you are using Stored Procedure to display
the result then choose Query Type should be Stored Procedure.
7) After connect to Query just Refresh the Fields, using this you can get all the parameters and fields
are visible in that Report properties, then click on OK button.
8) Now, you are successfully connect your Report Builder to Database.
9) Now, just choose the Insert tab in top menu bar and then choose Matrix table.

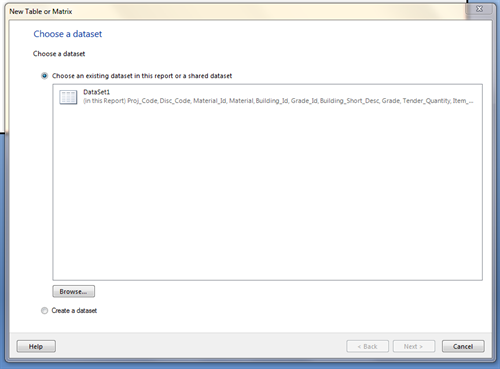
10) After Choose Matrix table a new window will open here you just choose your dataset to display your
Result to Report. Choose DataSource and then click Next button. If you are not create a DataSet then
choose Create DataSet Radio button and create DataSet.
11) After Choose DataSet a new window will open and there it’s showing all fields available in that Query.
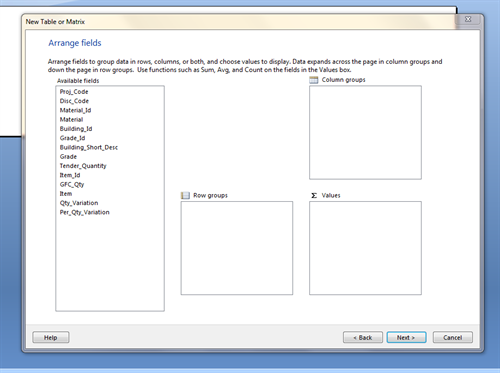
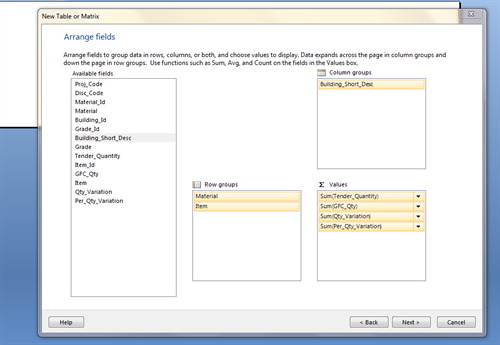
12) Choose columns and then Group columns based up on your requirement.
13) After arrange Grouped Columns then click on Next button. It will redirect next level.
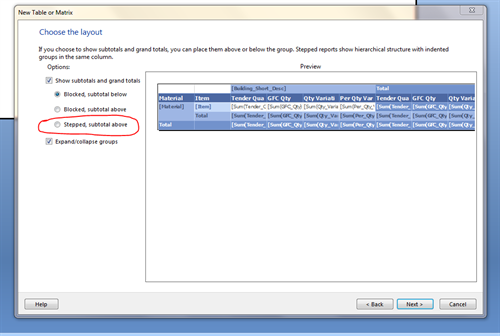
14) Here, Choose your report model which type you need here I choose the option Stepped Subtotal above option and then click Next button.
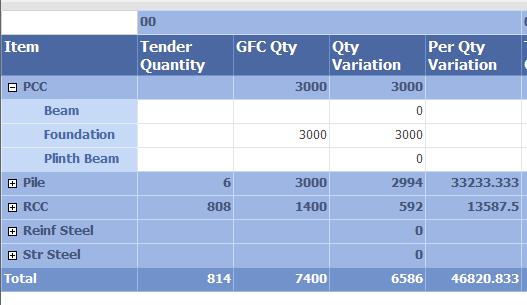
15) Now your report is ready to use. See the below result how looks like this is. If you do the same thing in
Application wise how much code we wrote for this. But using Reports we can easily display the result.

Conclusion:
Using Reports we can easily display the data based upon user requirement follow simple steps. Hope this article will help you some one who are looking to use Matrix table. |


No comments:
Post a Comment